


Statistical methods of investigation
Today the determination of synchronicities is made aided by software. In contrast to the graphical comparison aided only by a light table from the very beginnings of dendrochronology, the utilization of modern computers and software results in an enormous saving of time. The mathematical, statistical methods for the determination of synchronicities will be briefly described below:
Correlation coefficient
The correlation coefficient (r) tells us about the deviance from the average curve between the annual ring widths on the one hand and the reference material of the average curve on the other hand. Therefore the figure 1 means an absolute alignment (effectively impossible), 0 means an indifferent position and -1 means an absolute inversion. Thus the figure 0.5 describes a position rather synchronous than the figure 0.4. But only in context with the amount of annual rings and the determination of the so called T-ratio a generally intelligible and evaluative assertion may be made which is able to specify the statistical probability expressed as a percentage for instance. A percentage less than 99% should be rejected as too uncertain. 99.99% in contrast, would indicate a high degree of probability that the synchronicity which has been found actually is synchronous to the calendar. A 100% degree of probability is methodically impossible. For more information, please see Wikipedia.
Alignment
The so called degree of synchronicity (GL =Gleichläufigkeitswert) was the first method to be incorporated into the arsenal of dendrochronology. It describes the linear similarity between the average curve and the sample. The x/n figure and the degree of synchronicity are only distinguished through the mathematical way of notation. The qualitative appraisal of these figures may be compared to those of the correlation coefficient.
Dating index
The dating index (D) - first introduced by D. Eckstein – is a combination of the x/n figure and the correlation coefficient. Both methods are weighted in a certain ratio. The figure ≥ 100 does mean a good degree of certainty in a determined synchronicity.
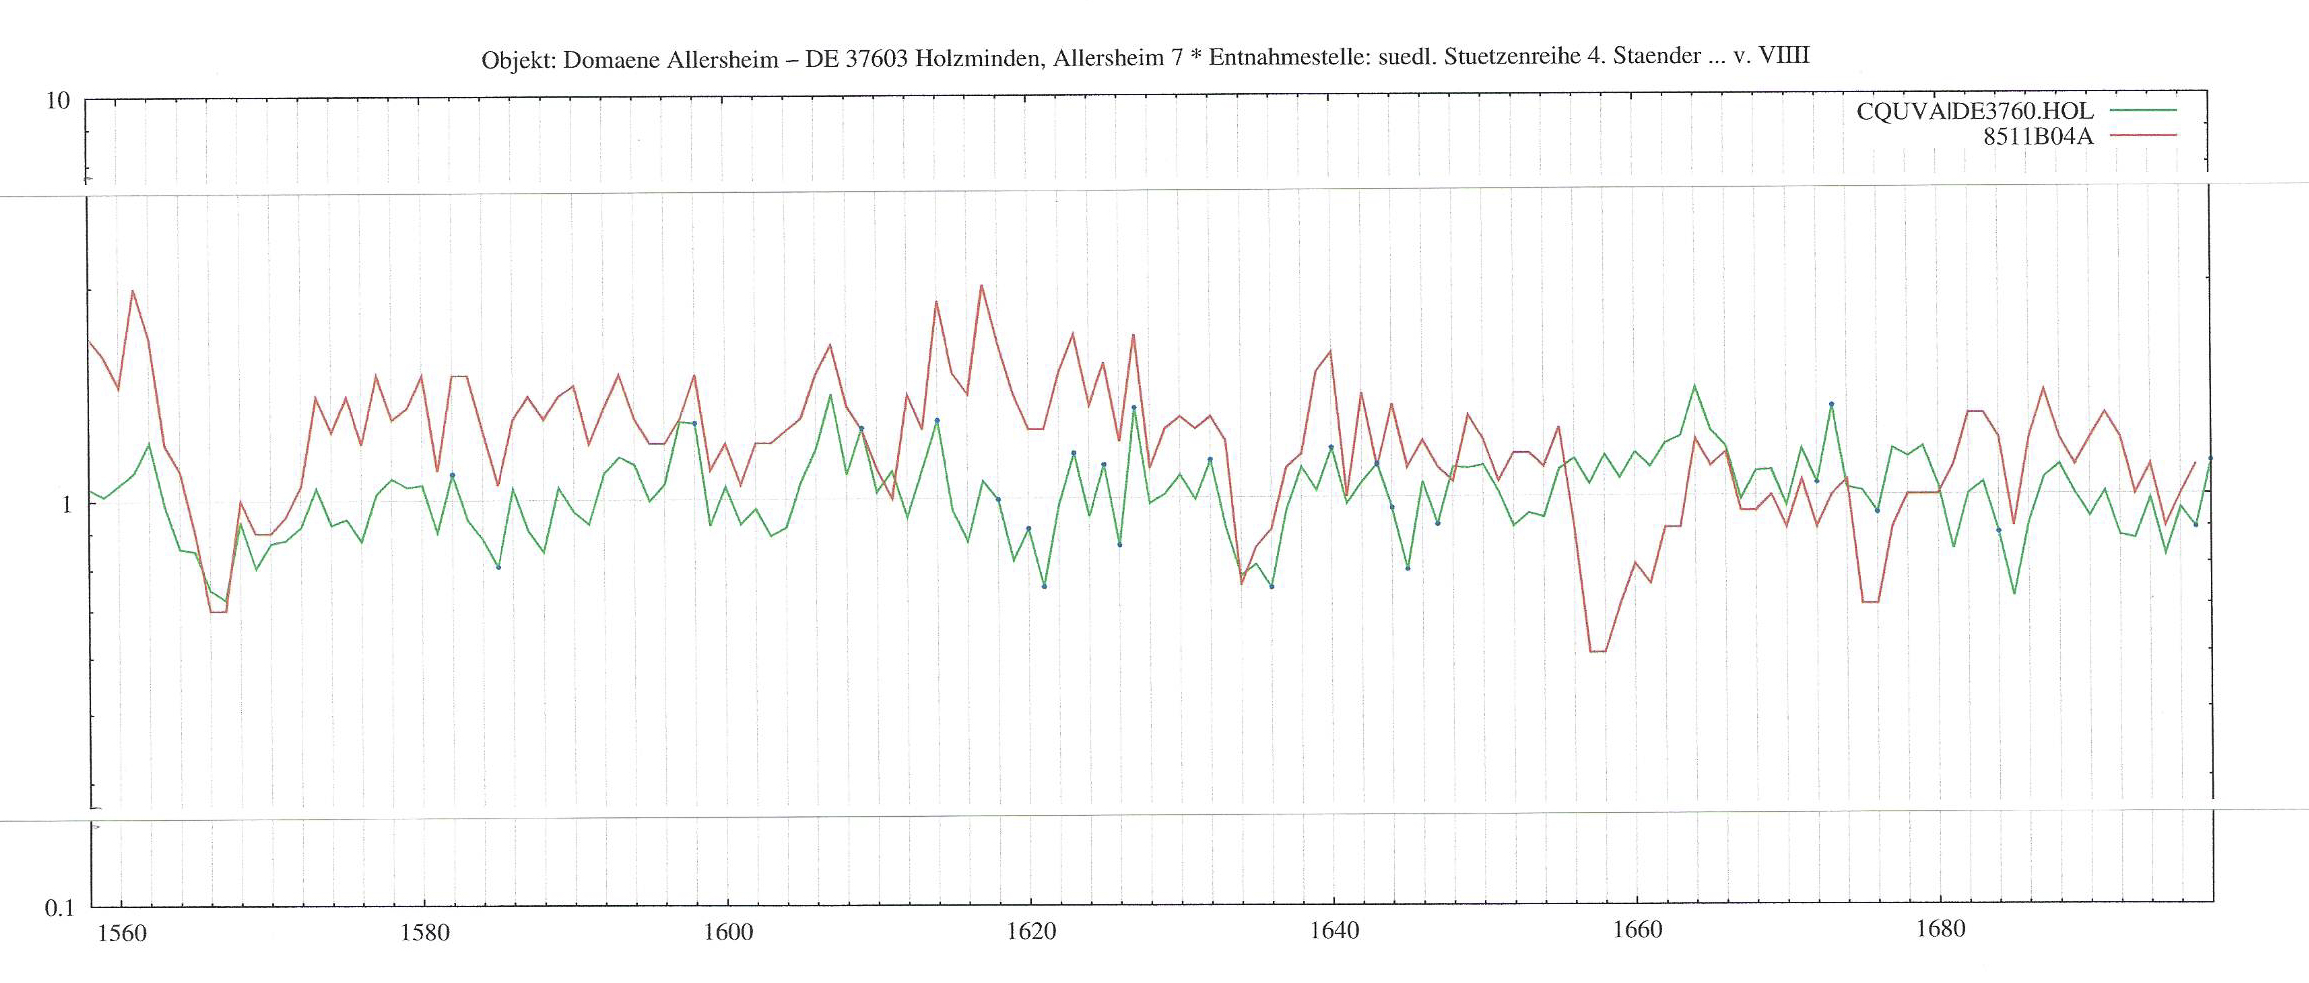
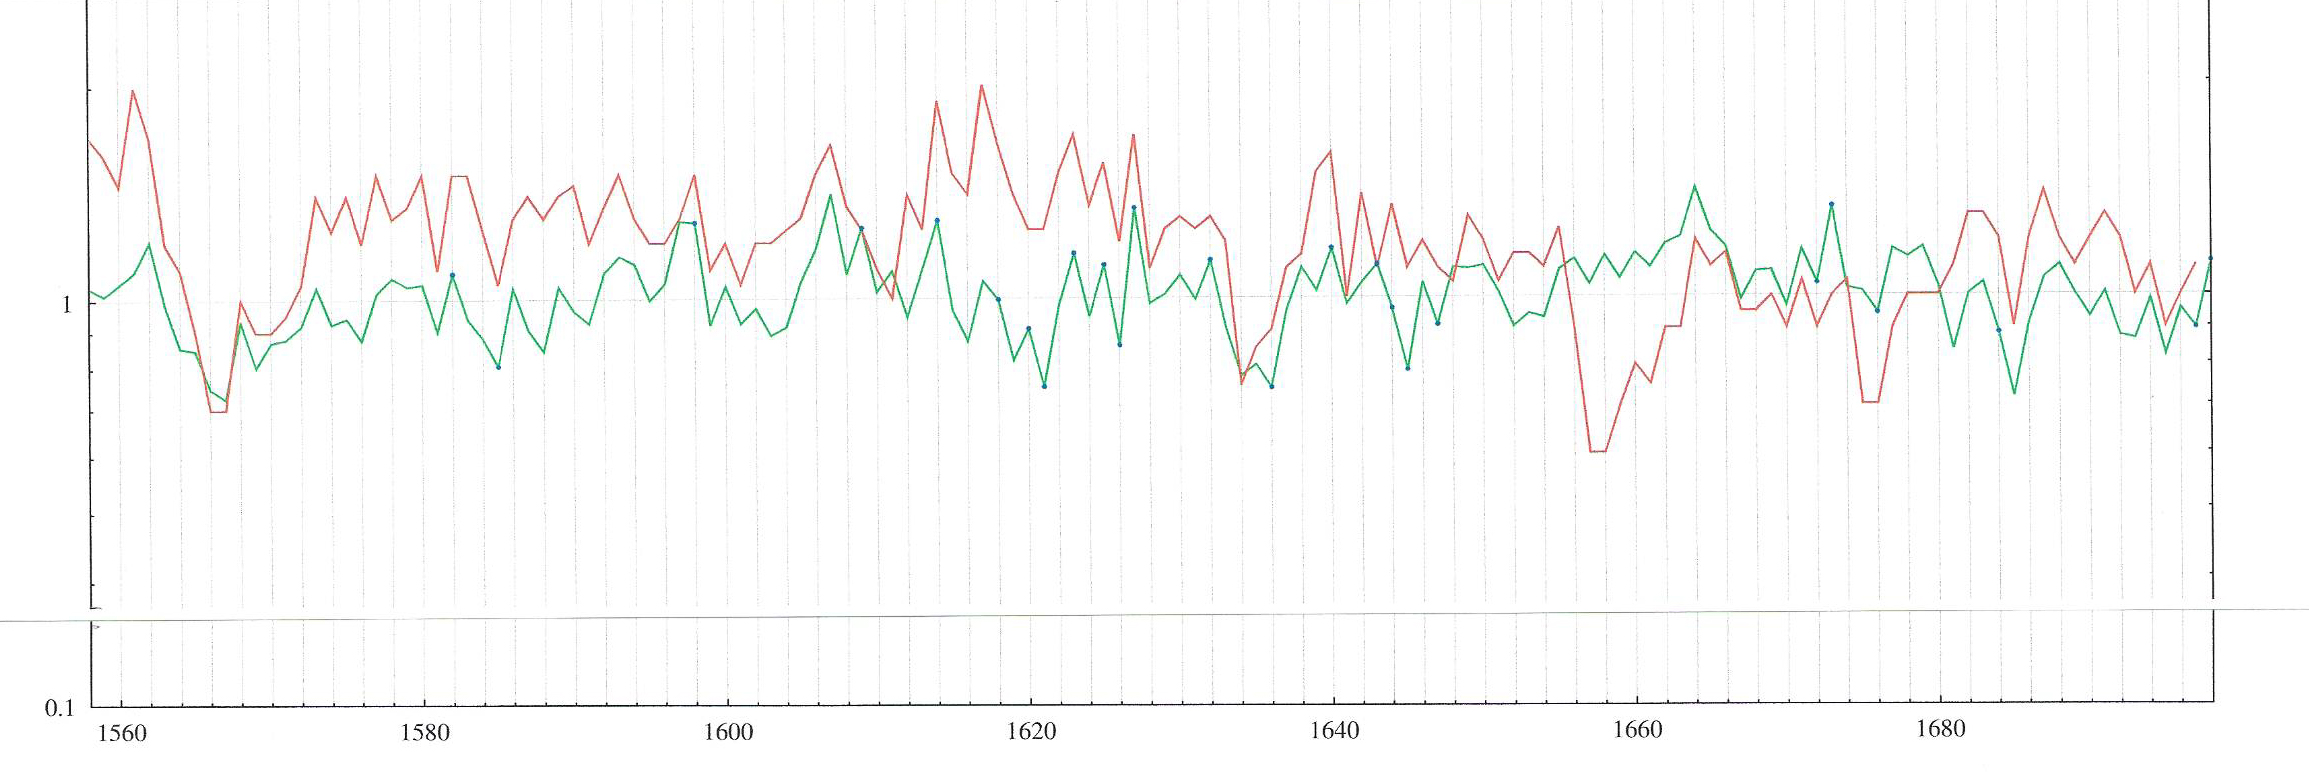
Curve comparison
The similarity of the two curves is easily recognizable even for the layman. (The Y-axis has been shortened in both curves for a better overview).